Brief outline of the low carbon town development plan
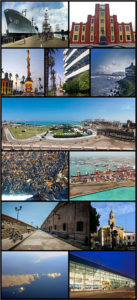
Lima-Callao Introduction
Within Peru, the Lima-Callao Metropolitan Zone17 is home to 9.5 million people, making it the 5th largest city in South America and by far the largest metropolitan area in Peru. Although Lima-Callao is home to 30% of Peru’s population, it represents the country’s commercial and financial centre. Most of Peru’s exports and imports pass through the port of Callao, which, located just 15 km from LimaCallao’s city centre and is one of the largest hubs in the region18. In total Lima-Callao accounts for 51% of Peru’s GDP and 84% of its taxes19.
Lima-Callao has grown rapidly in recent years – from 2000 to 2014 its population grew by 28% from 7.4 to 9.5 million. Lima-Callao’s growth is at times unplanned – with the expanding population moving up the surrounding valleys where informal settlements are constructed on the hillsides. These settlements – which are home to approximately 12% of the total population – tend to have limited access to water (an estimated 10% of Lima-Callao’s population is without direct access to water)20, sanitation and electricity. Informal water use accounts for 4% of Lima-Callao’s overall water use, with informal users getting most of their water from water trucks which charge up to 9 times as much as the rate charged through a formal connection21. Informal electricity use accounts for 3% of Lima-Callao’s total electricity consumption, with electricity supplied through clandestine connections to the grid.
As Lima-Callao has grown, so some of its environmental challenges have increased. In terms of energy use, the use of hydroelectric power and gas has made the carbon emissions of electricity generation lower than in many other cities. However, increasing demand for electricity, led both by a growing population and rising GDP, has led to higher overall carbon emissions from the energy sector. Based on our work in this report, we find that energy use in Lima-Callao has risen by 82% since 2000, and that carbon emissions from the city have increased by 98% over the same period. More broadly, Lima-Callao accommodates over 70% of Peru’s transport fleet, and emissions from transport have a significant impact not only on carbon emissions but also on urban air quality. Pollution from the approximately 1.2 million vehicles in the capital22, including 60,000 public buses with an average age of 16 years, is said to be amongst the worst in South America2
In terms of water use, with less than 10mm of rain falling in Lima-Callao each year, the city is among the world’s largest municipal areas situated in a desert. As a result, Lima-Callao is largely dependent for water resources on the Rimac, Chillon and Lurin rivers, whose watersheds originate in the Andes mountains24. However, supplies from these sources are close to being fully exploited, and forecasts of the impacts of climate change suggest that there is a real risk of significant reductions in water supply, with forecasts predicting that precipitation across the Mantaro basin could decrease 19% by 205025. Meanwhile, demand for water in Lima-Callao is increasing rapidly, largely because of an increasing population within the city. We find that water use in Lima-Callao increased by 21% in the period from 2000 to2014.
The key environmental policy that has been adopted in Lima-Callao is ‘La Agenda Ambiental Metropolitana.’ This policy, which prioritizes the rational use of natural resources and improving the quality of the city’s environment, is a tool for environmental management in Lima-Callao. It incorporates specific objectives such as, ‘optimizing the disposal of solid waste throughout the city’ which has been addressed with the launch of 20 city-wide recycling programmes26. Other specific objectives include the reorganization and strengthening of environmental management in Lima-Callao, the improvement of the tools to monitor air quality and the promotion of non-motorized transport, along with several others. A 2025 Roadmap for Sustainable Transportation in Lima-Callao has been recently been developed27 and national plan for the integration of urban transport has also been considered recently which has the goals of shortening journey times, improving transport efficiency and enhancing the health of urban settlers
The Energy Sector
Mitigation measures for the National Interconnected System (SEIN) grid were formulated from a combination of expert consultations, academic papers and industry data. Baseline projects for the SEIN grid were based on APEC’s 2013 projections for electricity production in Peru through 203553 and primary data from the Committee of Economic Operation of the National Interconnected System (COES-SINAC). Mitigation scenarios were developed through consultation with stakeholders in Lima-Callao, and with guidance from COES-SINAC. All scenarios result in the same volume of electricity production in 2030.
The Domestic Sector
Residential emissions are made up of electricity based emissions, waste, water and direct combustion (see industry above for an explanation of how the direct combustion element has been calculated). The electricity related emissions are based on data on energy consumption per capita in the city of LimaCallao and subsequently scaled across electricity using sectors (including residential use) based on Peruvian data and corrected for transmission losses.
The electricity cost of the residential sector has been valued at US$700 million in 2014 and is predicted to grow to US$1550 million by 2030.
The Commercial Building Sector
Commercial emissions are made up of electricity based emissions for the commercial sector, an estimate of direct fugitive emissions and public lighting and water related emissions for the commercial and government sectors (both process and electricity related emissions). The electricity data is based on energy consumption per capita in the city of LimaCallao59 and subsequently scaled across electricity using sectors (including commercial and public lighting use) based on Peruvian data60 and corrected for transmission losses. The cost of the commercial sector has been valued at US$180m in 2000 and is predicted to grow to US$1,080m by 2030.